The QC data is analyzed using a shorter version of the standard Fiber-seq data analysis workflow.
Some familiarity with command-line tools is required. However, because the dataset is small (~100 Mb) the analysis can typically be run on a personal workstation.
Plasmidsaurus provides BAM files with 6mA basecalling already performed using Dorado. These BAM files still need to be aligned to your reference genome before they can be used with fibertools-rs, the data analysis package that adds feature annotations such as nucleosomes and methylation-sensitive patch (MSP) locations.
Recommended analysis steps
Align the BAM file: Use the Dorado aligner command to align the reads to your reference genome. Dorado is available on GitHub.
Add Fiber-seq annotations: Run ft add-nucleosomes from fibertools-rs. This adds nucleosome positions and methylation-sensitive patch (MSP) annotations to the BAM file.
Run Fiber-seq QC tools: Use the annotated BAM file as input to the fiberseq-qc toolset.
See Figure 1 below for example commands for each step.
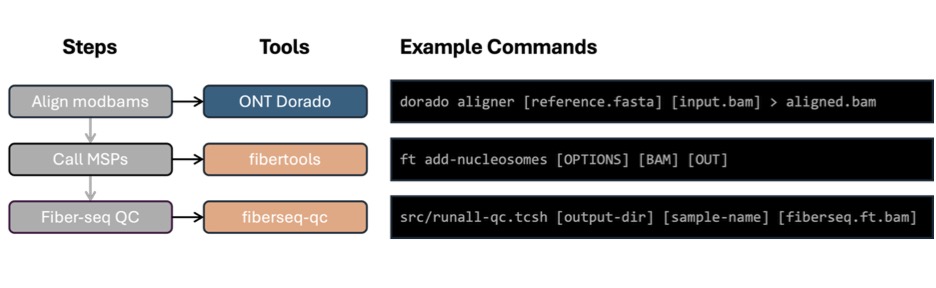
Figure 1. Recommended analysis workflow. Plasmidsaurus returns bam files with basecalling already performed. These can be used directly in ONT’s Dorado aligner tool to align to your reference. The aligned bam files are then used as input in fibertools-rs to add MSP/nucleosome calls to the aligned bams. Finally, the aligned bams with MSP/nucleosome calls are used in fiberseq-qc to generate the QC plots needed to assess the success of the Fiber-seq experiment.
What should you check?
Before proceeding to deep sequencing, confirm that the following plots look biologically consistent (and see Figure 2 for visual examples):
MSP length histogram
The median MSP length should be close the expected length of linker DNA, usually between 30-60bp.
If more than 3% of MSPs are >400bp, this may indicate your sample contained de-chromatinized DNA as a result of improper sample handling.
A large % of MSPs of 1bp is normal.
Nucleosome size histogram
This histogram should display 2 peaks: 1 large peak representative of mono-nucleosome lengths and a second, smaller peak representative of di-nucleosome lengths.
The median mono-nucleosome length should be around 147bp.
6mA per read histogram
The median proportion of 6mA per read should be between 4-10%.
This should be a single, relatively normally distributed peak.
Autocorrelation plot
This plot should show a sinusoidal curve with 2 x-intercepts of approximately the same values as you’d expect for linker DNA and nucleosome footprint length. Note that these values may not match the values from plots listed above—that is okay.
1 x-intercept should be roughly between 40-70
1 x-intercept should be roughly between 135-160
Because QC sequencing uses only ~100 Mb of data, the plots may appear noisier or more jagged compared to a full dataset. This is expected. A typical deep sequencing run may generate tens of gigabases of data, resulting in smoother plots. The overall shape and trends, however, should be similar to those shown in Figure 2.
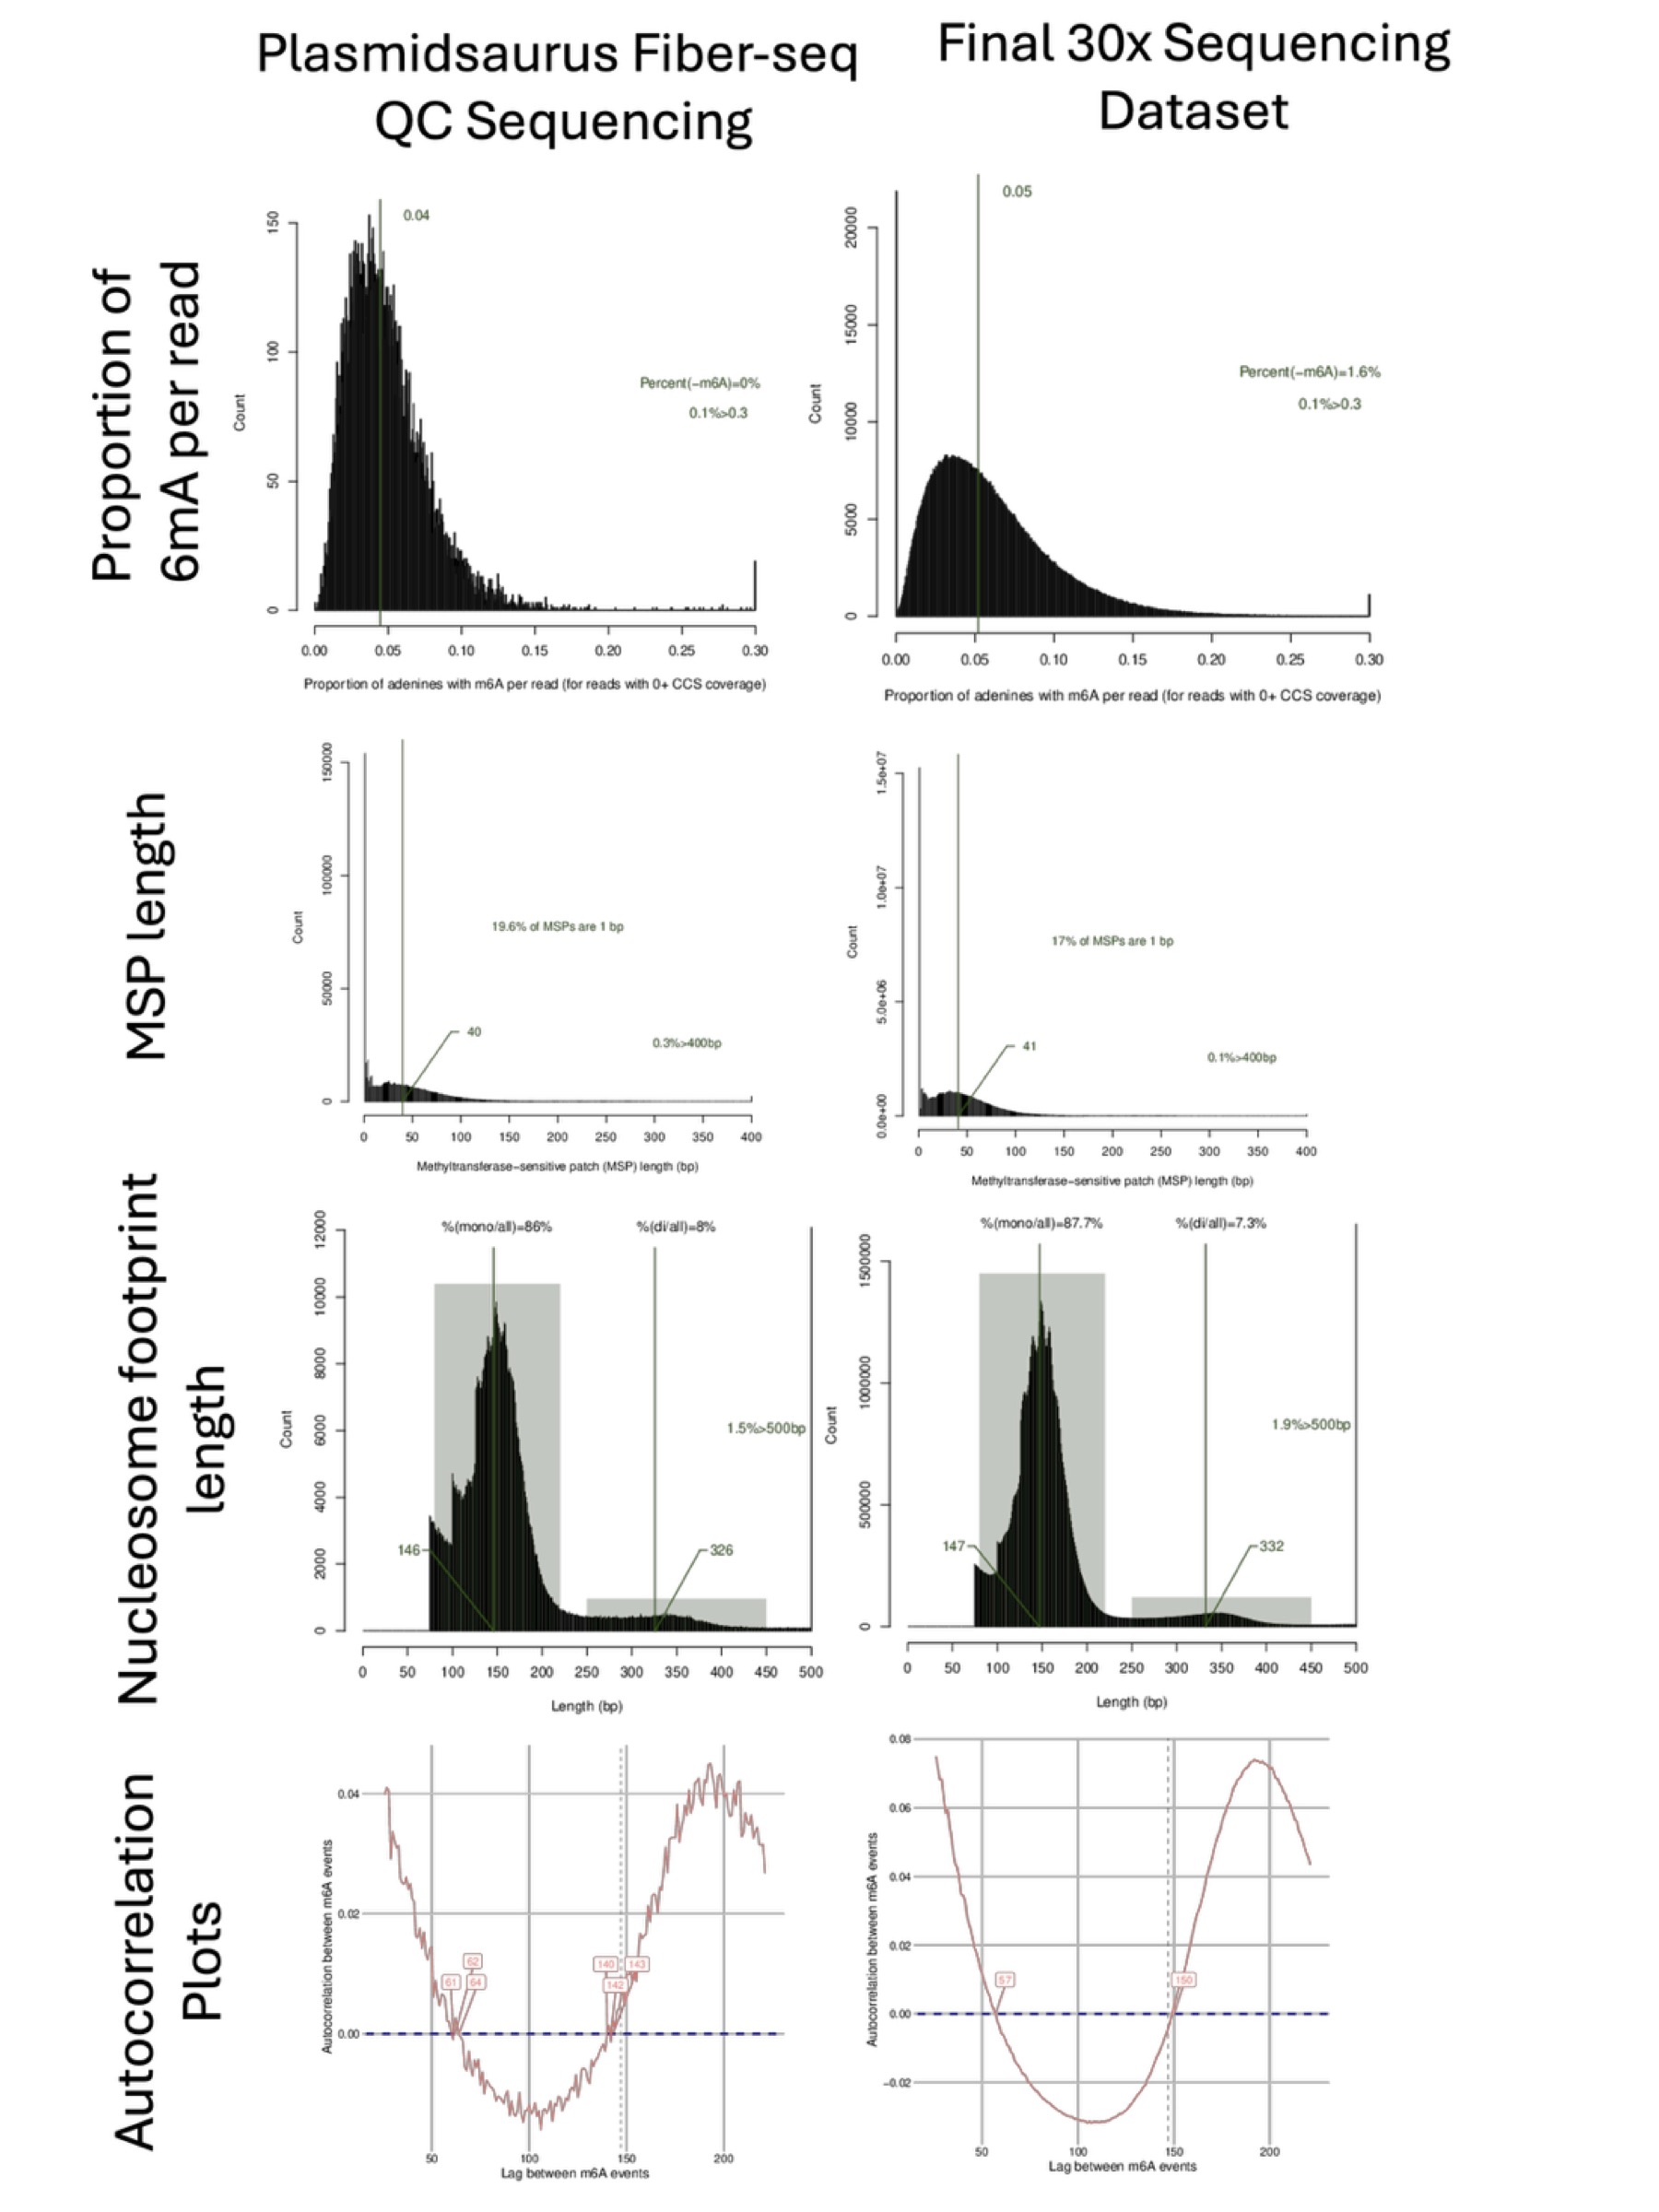
Figure 2. Example Fiber-seq QC data and full 30X data from the same sample.