One reason researchers may hesitate to move away from ChIP-seq is the enormous amount of existing ChIP-seq data available through resources such as the ENCODE Project. If your lab, or your reviewers, expects new experiments to be benchmarked against established ENCODE datasets, switching methods can feel risky. However, because CUT&RUN and ChIP-seq both map the genomic localization of chromatin-associated proteins and histone modifications, CUT&RUN profiles can be compared with existing ChIP-seq datasets for features such as peak locations, genomic distributions, and overlap with previously characterized regulatory regions. In fact, this type of comparison has already been demonstrated in the literature: Janssens et al. [1] directly compared AutoCUT&RUN profiles with ENCODE ChIP-seq datasets, including experiments performed using the same antibody, and found that CUT&RUN recovered the corresponding genomic features while producing substantially lower background—even though the ENCODE ChIP-seq datasets contained more mapped reads (Figure 2).
There are also computational tools specifically designed to facilitate comparisons between ChIP-seq and CUT&RUN datasets. For example, EpiCompare, a Bioconductor package for benchmarking epigenomic datasets [2], includes workflows for comparing CUT&RUN and CUT&Tag data against ENCODE ChIP-seq reference datasets. This provides researchers with a standardized way to evaluate how well newly generated profiles reproduce established chromatin features.
So, if maintaining continuity with historical ChIP-seq data is holding you back from trying CUT&RUN, you don't necessarily have to choose between the two: CUT&RUN can provide the advantages of a newer chromatin profiling method while still allowing you to benchmark your results against the ENCODE and ChIP-seq datasets that have defined the field.
Important note: If you are transitioning to CUT&RUN and looking to compare your new data with past ChIP-seq work, it’s important to note that raw signal intensity therefore shouldn't be assumed to be directly equivalent between assays, and appropriate normalization and analysis strategies should be used when making quantitative comparisons.
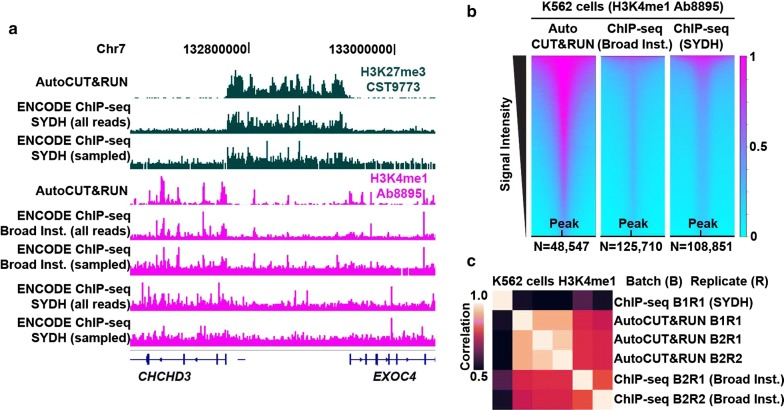
Figure 1. Republished from [1]: “Comparison of AutoCUT&RUN versus ENCODE ChIP-seq. A) A representative silenced domain flanked by active genes is shown for human K562 cells probed using the same antibodies by either AutoCUT&RUN or ChIP-seq. For each comparison, ChIP-seq tracks are shown that include either all sequenced fragments or the same number of sampled fragments as the AutoCUT&RUN data. B) Heat map comparison of H3K4me1 Ab8895 ± 1 kb around peak centers (summits) called by MACS2 for AutoCUT&RUN data and for ENCODE ChIP-seq data (broad peaks by Broad Institute and narrow peaks by SYDH). Signal intensities reflect the relative number of reads that fall within peaks. C) Correlation matrix comparing batches (B) and replicates (R ) between AutoCUT&RUN and ENCODE ChIP-seq datasets for H3K4me1 Ab8895”.
References
Janssens DH et al. Automated in situ chromatin profiling efficiently resolves cell types and gene regulatory programs. Epigenetics & Chromatin (2018).
Choi S, Schilder BM, Abbasova L, Murphy AE, Skene NG (2022). “EpiCompare: R package for the comparison and quality control of epigenomic peak files.” bioRxiv. https://doi.org/10.1101/2022.07.22.501149.