Here, we will discuss how to use SNAP-CUTANA Spike-in results to troubleshoot problematic workflows. To learn how to apply SNAP-CUTANA Spike-ins to confirm workflow success, see this article. Note that while the data shown here is from CUT&RUN, these principles can be applied in all CUTANA assays.
Example Data from a CUT&RUN Experiment
Figures 1 and 2 demonstrate the use of K-MetStat Spike-in data for troubleshooting. In Figure 1 we used spike-in data from H3K4me3, H3K27me3, and IgG control reactions to validate CUT&RUN workflows for three independently prepared mouse B cell samples. Key takeaways:
Samples 1 and 2 showed expected results from control reactions, while Sample 3 displayed low signal-to-noise (S:N) and high off-target PTM recovery (Figure 1).
Genomic profiles agreed with spike-ins: Samples 1 and 2 generated expected tracks for H3K4me3 & H3K27me3, while Sample 3 profiles had poor S:N (Figure 2).
To troubleshoot Sample 3 reactions, we considered the following:
All reactions were performed in parallel using the same antibodies and reagents. However, only Sample 3 reactions had problems with background.
Sample 3 showed poor S:N in both genomic profiles and K-MetStat Panel data.
Sample 3 generated poor profiles across multiple targets.
Combined, these results suggested problems with sample prep vs. a complete workflow failure. We subsequently reviewed Sample 3 processing methods, revealing that the number of cells used per reaction was much lower than intended. For other troubleshooting tactics using the K-MetStat Panel, see the Table (below).
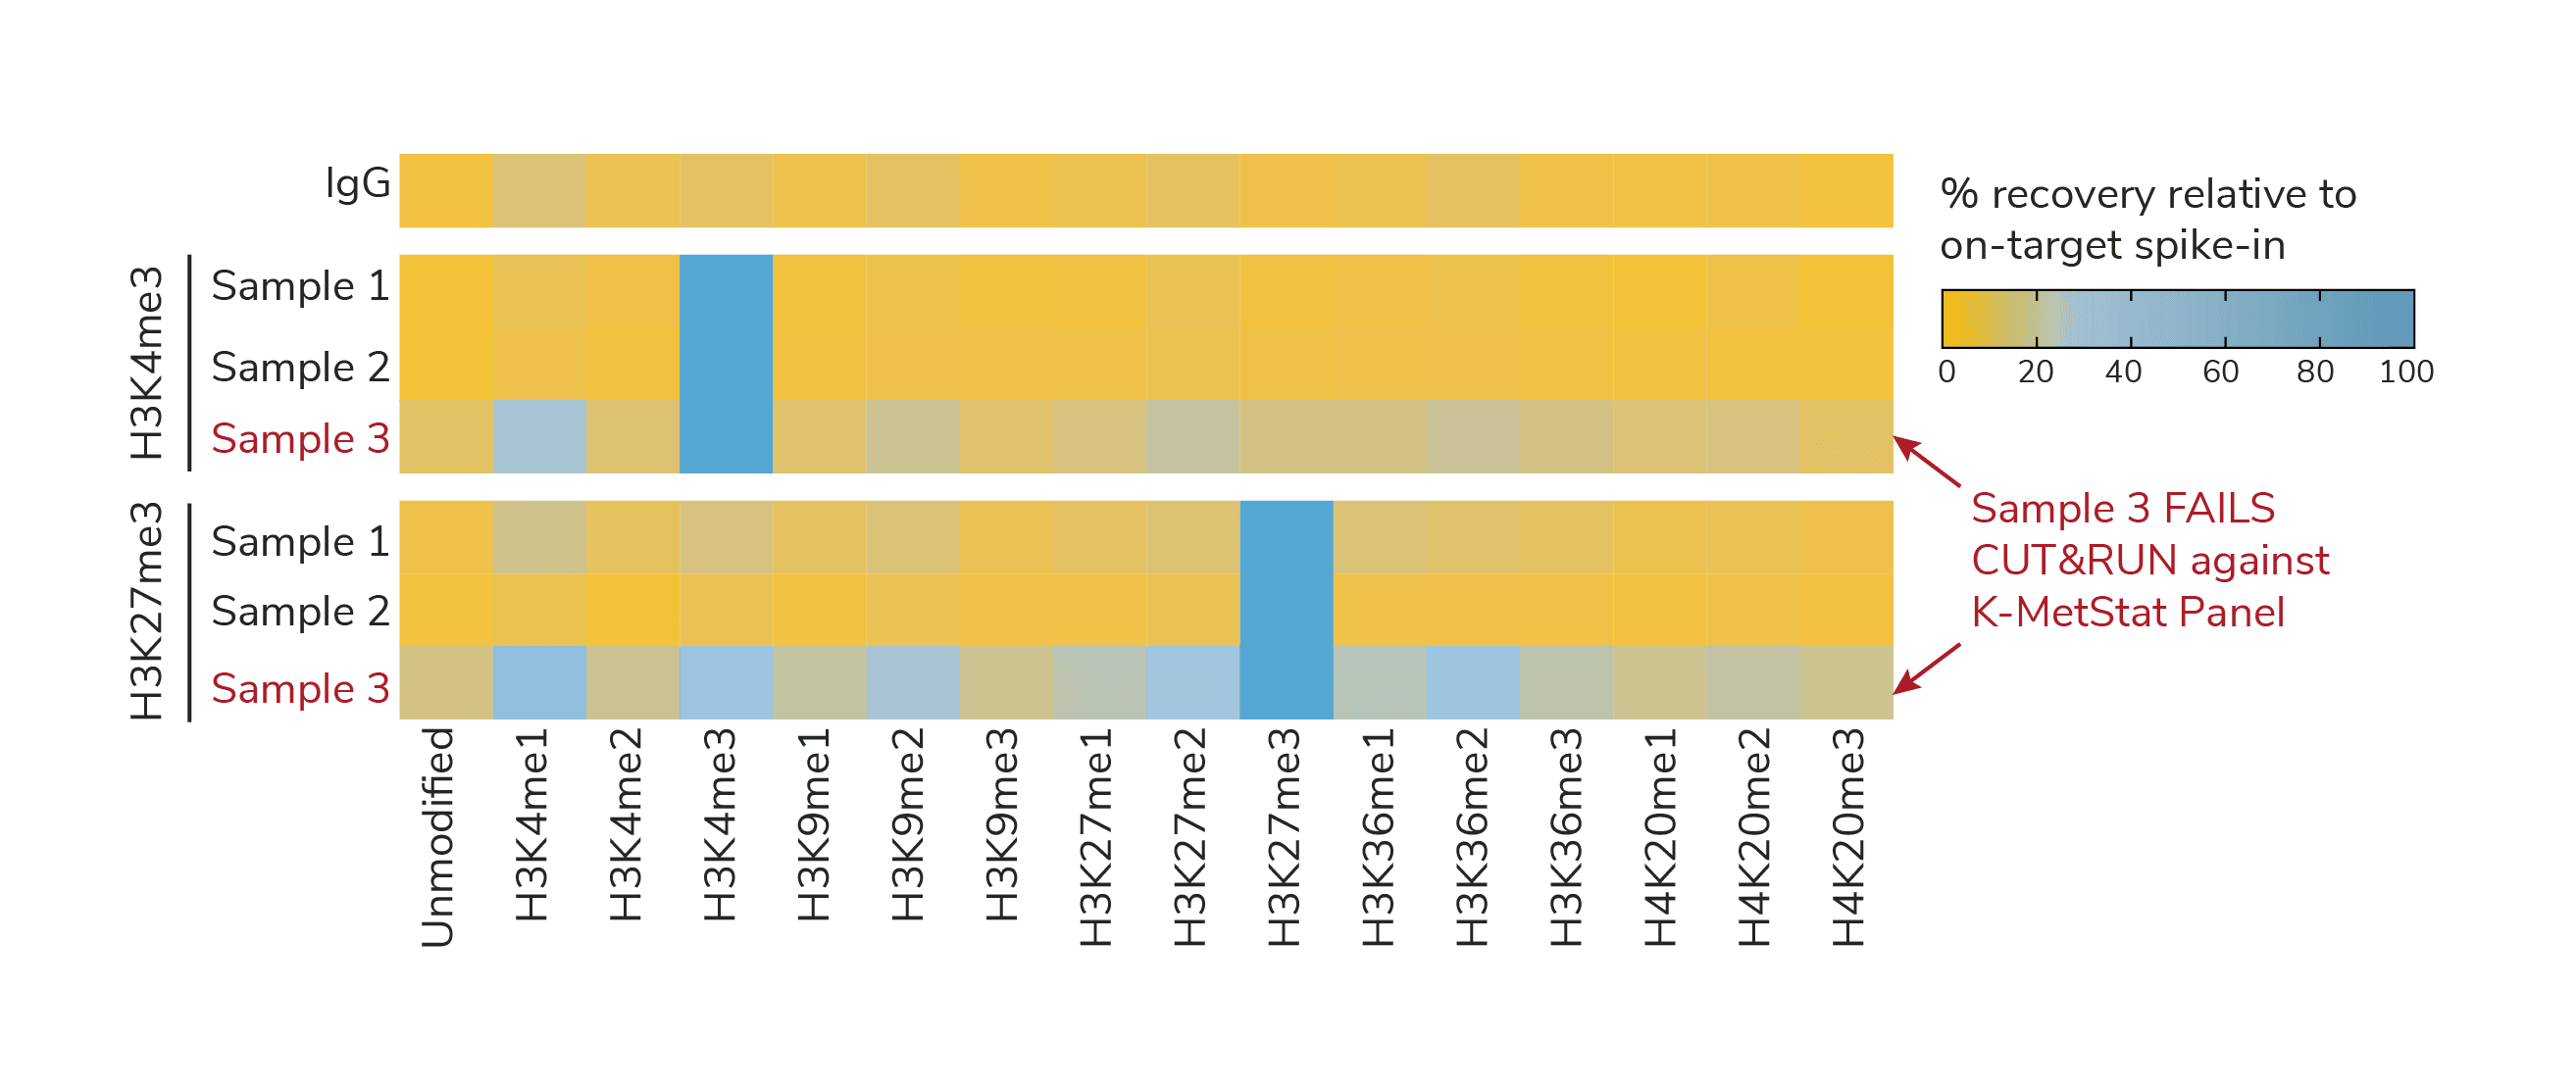
Figure 1. K-MetStat Spike-ins validate workflows and flag poor samples in CUTANA CUT&RUN experiments. Spike-in data for H3K4me3 positive control reactions is shown for three independently prepared mouse B cell samples (10,000 cells each; protocol optimization experiment with a multi-lab consortium). Samples 1 and 2 show expected results, while Sample 3 was flagged for recovery of off-target PTMs and low signal-to-noise. Representative data from one IgG reaction is shown as a negative control.
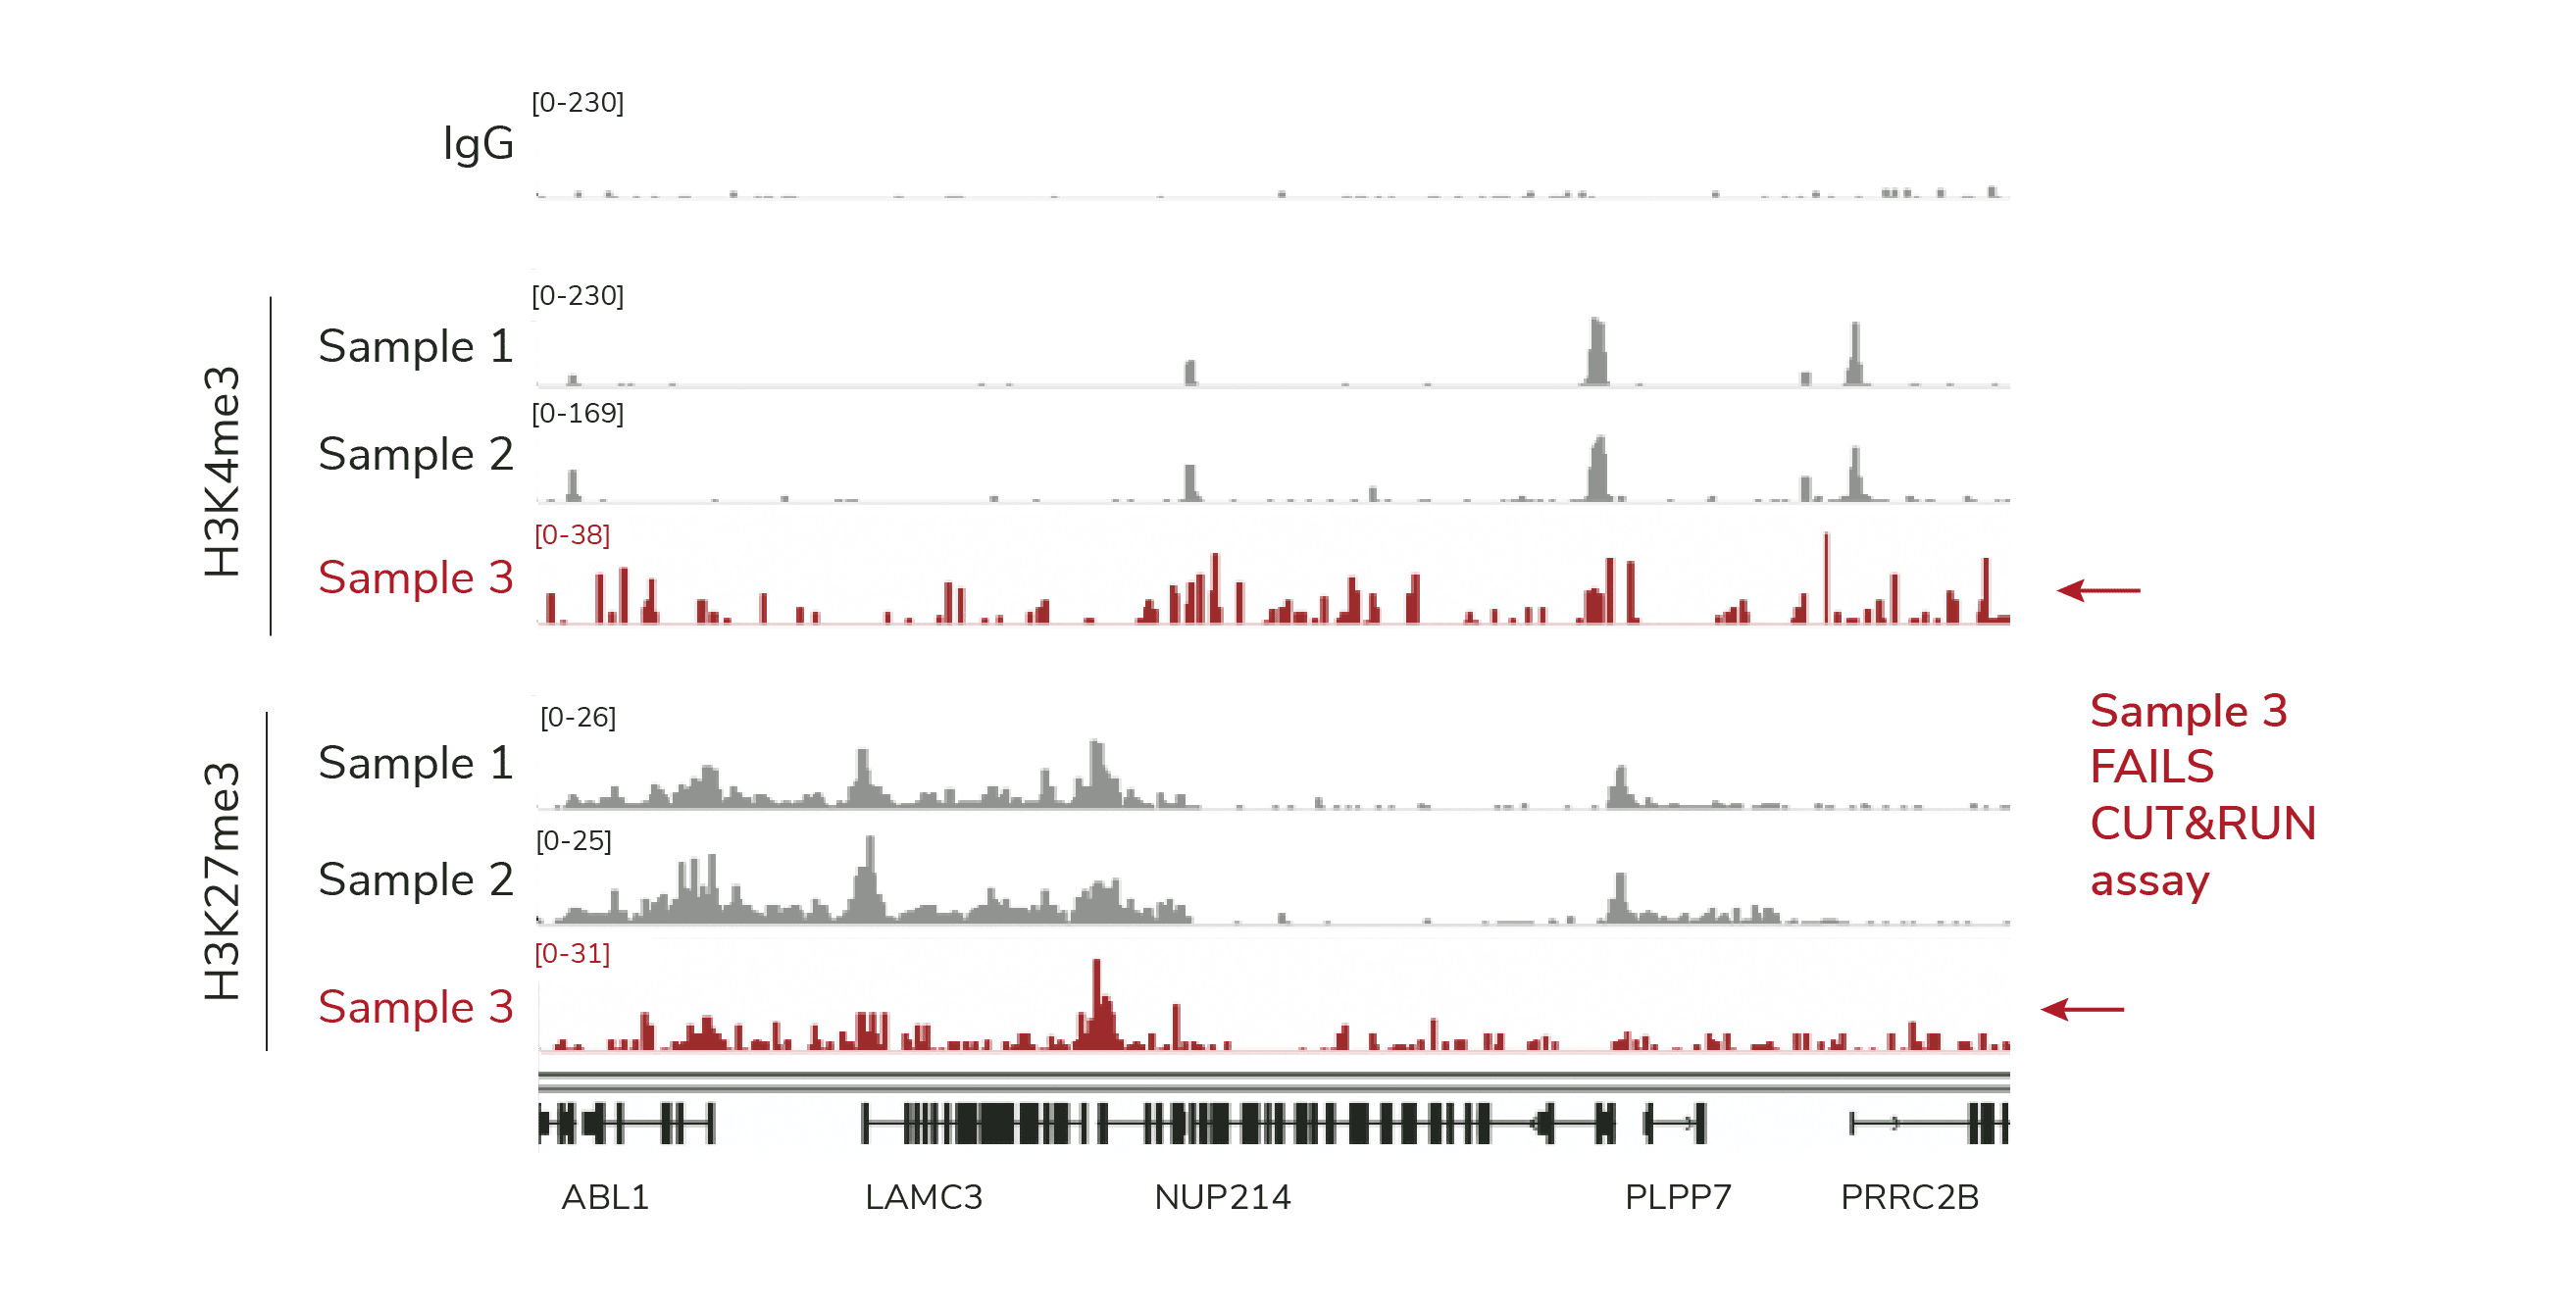
Figure 2. Genomic tracks featuring data in Figure 1. CUT&RUN was used to map IgG (negative control), H3K4me3 (positive control) and H3K27me3 in three independently prepared mouse B cell samples (10,000 cells each; protocol optimization experiment with a multi-lab consortium). A representative 400 kb region is shown. Samples 1 and 2 show consistent peaks, while Sample 3 displays low S:N (red).
SNAP-CUTANA Spike-in Troubleshooting Table
Results | Causes and troubleshooting approaches |
|---|---|
K-MetStat spike-in data:
Genomic data:
| pAG-MNase/pAG-Tn5 cleavage and wash conditions are optimized. Control antibodies are performing as expected. Problems may include: ⚠ Low numbers of cells
⚠ Poor sample prep
⚠ Experimental target requires different processing conditions
|
K-MetStat spike-in data:
Genomic data:
| ⚠ Indicates a fundamental failure in the workflow
⚠ Low numbers of cells and/or poor sample prep
|
K-MetStat spike-in data:
Genomic data:
| ⚠ Indicates cross-reactive control antibodies
|