SNAP-CUTANA™ data analysis protocol
This protocol can also be used to analyze SNAP-CUTANA Spike-in data from CUT&RUN and CUT&Tag reactions. CUT&RUN data are shown as an example.
Download R1 & R2 paired-end sequencing files (fastq.gz) for control reactions. Double-click the fastq.gz files to create fastq files and save in a new folder.
On the SNAP-CUTANA Spike-in product page (e.g. K-MetStat Panel), under Documents and Resources, download the Shell Script (.sh) and K-MetStat Panel Analysis (.xlsx) files. Save to the folder from Step 1.
Open the .sh file in TextEdit or any text editing program. Do NOT open in Word or a PDF program. Scroll past the barcode sequences to find the analysis script.
The script is a loop that counts the number of reads aligned to each PTM-specific DNA barcode in a reaction. Each PTM in the SNAP-CUTANA Panel is represented by two unique barcodes, A & B. For the script, you need to create one loop per control reaction. To customize:
Copy lines between # template loop begin ## and # template loop end ##.
Paste the loop under the last done. Paste one copy per control reaction.
In the first loop replace sample1_R1.fastq and sample1_R2.fastq with R1 & R2 fastq file names for one control reaction. Repeat for each loop. Press save.
In Terminal, set the directory to your folder: Type cd and press space. Drag the folder from your files into Terminal to copy the location. Press return.
Run your script in Terminal: Type sh and press space. Drag your .sh file from your files into Terminal to copy the file location. Press return. Terminal generates barcode read counts from R1 & R2 reads, one loop/reaction at a time.
Open the Panel Analysis Excel .xlsx file. Fill in reaction names and set the on-target PTM in Column B. The first reaction is set to IgG (negative control); for other reactions, select a target (i.e. H3K4me3) from the drop-down menu.
Copy R1 barcode read counts from the first loop in Terminal. In Excel, paste into the yellow cells for that reaction in Column C. Copy & paste the R2 read counts from the same loop to yellow cells in Column D. Repeat for each loop/reaction.
The Excel file automatically analyzes spike-in data for each reaction by:
Calculating total read counts for each DNA barcode (R1 + R2) in Column E.
Calculating total barcode read counts for each PTM (A + B) in Column F.
Expressing total read counts for each PTM as a percentage of on-target PTM read counts (Columns G & J), providing a readout of on- vs. off-target PTM recovery and antibody specificity.
Column J auto-populates the Output Table (Figure 2). Reactions are separated by row and PTM data are sorted into columns. A color gradient is used to visualize the recovery of each PTM normalized to on-target PTM, from blue (100%) to orange (less than 20%).
For each reaction, calculate the percent of unique sequencing reads that have been assigned to spike-ins. In Excel, type the total number of unique reads in the yellow cell Uniq align reads (in Column B). The % total barcode reads is calculated in the cell immediately below and is added to the Output Table.

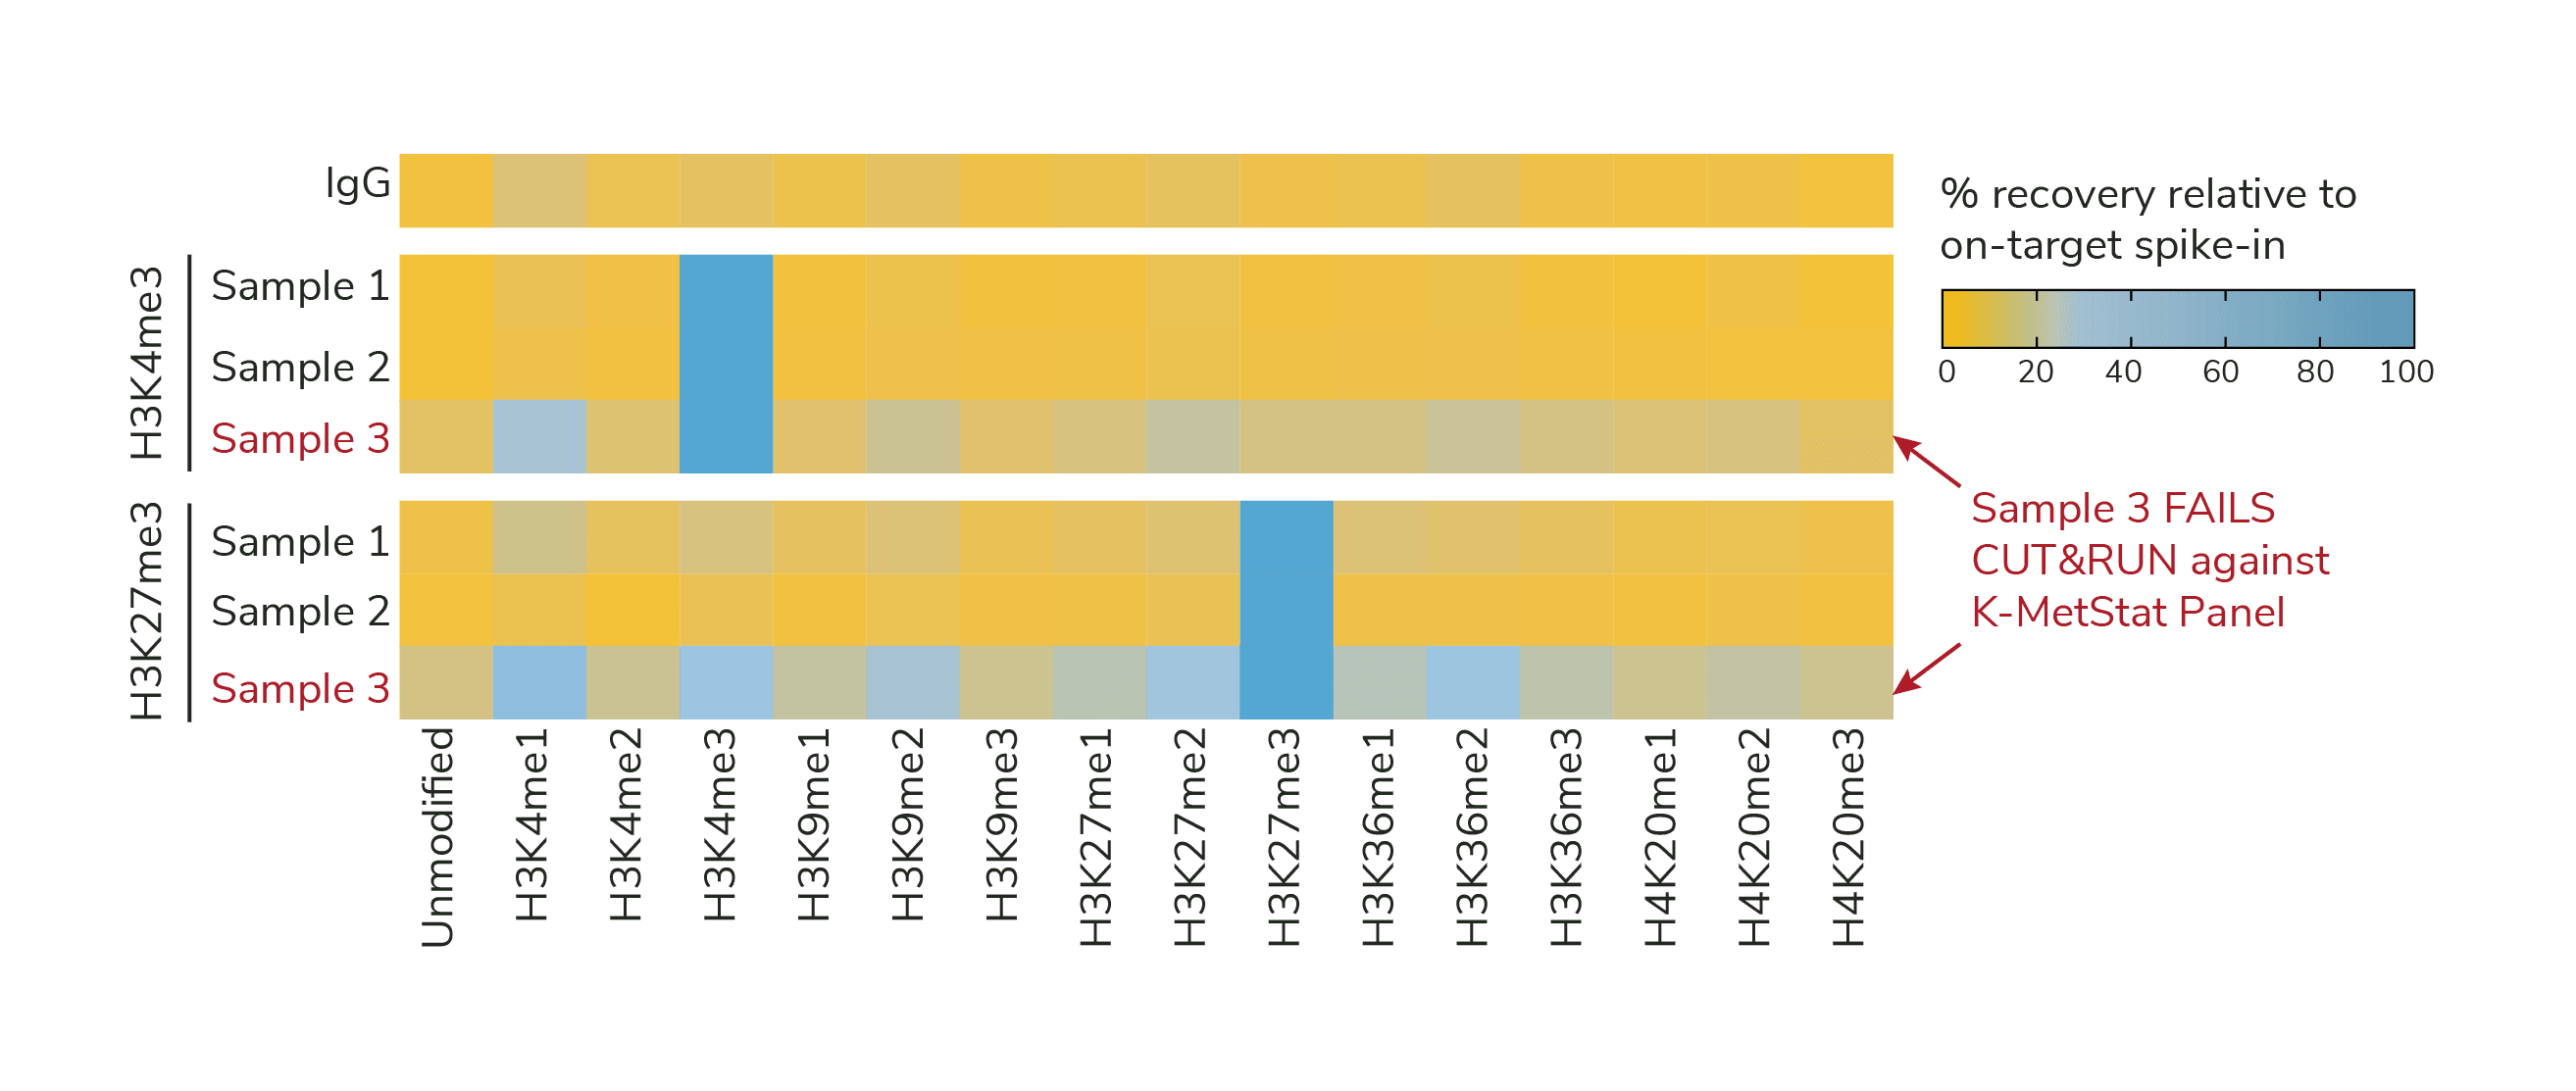
Figure 1. K-MetStat Spike-ins validate workflows and flag poor samples in CUTANA experiments. Spike-in data for H3K4me3 and H3K27me3 positive control reactions is shown for three independently prepared mouse B cell samples (10,000 cells each) in CUT&RUN. Samples 1 & 2 show expected results, while Sample 3 was flagged for recovery of off-target PTMs and low signal-to-noise. Representative data from one IgG reaction is shown as a negative control.
Expected results from SNAP-CUTANA Spike-in control reactions
The IgG negative control shows low background and no preference among PTMs (Figure 1, Top row).
Positive controls (e.g., H3K4me3, H3K27me3, or H3K36me3) has strong enrichment for its target nucleosome spike-ins, less than 20% off-target PTM recovery, and high signal-to-noise (Figure 1, Samples 1 and 2).
Spike-in barcode reads comprise ~1% (0.5-5%) of total sequencing reads. This may vary based on target abundance and sequencing depth. The main goal is to have thousands of reads, which will allow adequate sampling of the K-MetStat Panel for reliable data analysis.
If control reactions generate expected spike-in data (Figure 1, Samples 1 and 2), you can be confident in the technical aspects of your workflow.
More than 20% off-target PTM recovery in the positive control and/or high background in IgG control indicate experimental problems (Figure 1, Sample 3). See this article for guidance for using SNAP-CUTANA Spike-in controls to troubleshoot workflows.