Here we outline the expected metrics for successful CUT&RUN sequencing, including number of sequencing reads, duplication rates, and data from CUT&RUN control reactions.
CUT&RUN sequencing metrics
Libraries should be sequenced to a depth of 3-8 million total reads. The majority of reads (>80%) should align uniquely to the species genome.
Sequence duplication levels should be low (<20% of total sequence reads).
The SNAP-CUTANA™ K-MetStat Panel should comprise ~1% of unique reads and produce expected results in H3K27me3, H3K4me3 and IgG control reactions. See this article for help with K-MetStat Panel data analysis.
E. coli Spike-in DNA should comprise ~1% of total unique reads.
Target enrichment and peak structure should be consistent with biological function (if known).
CUT&RUN controls
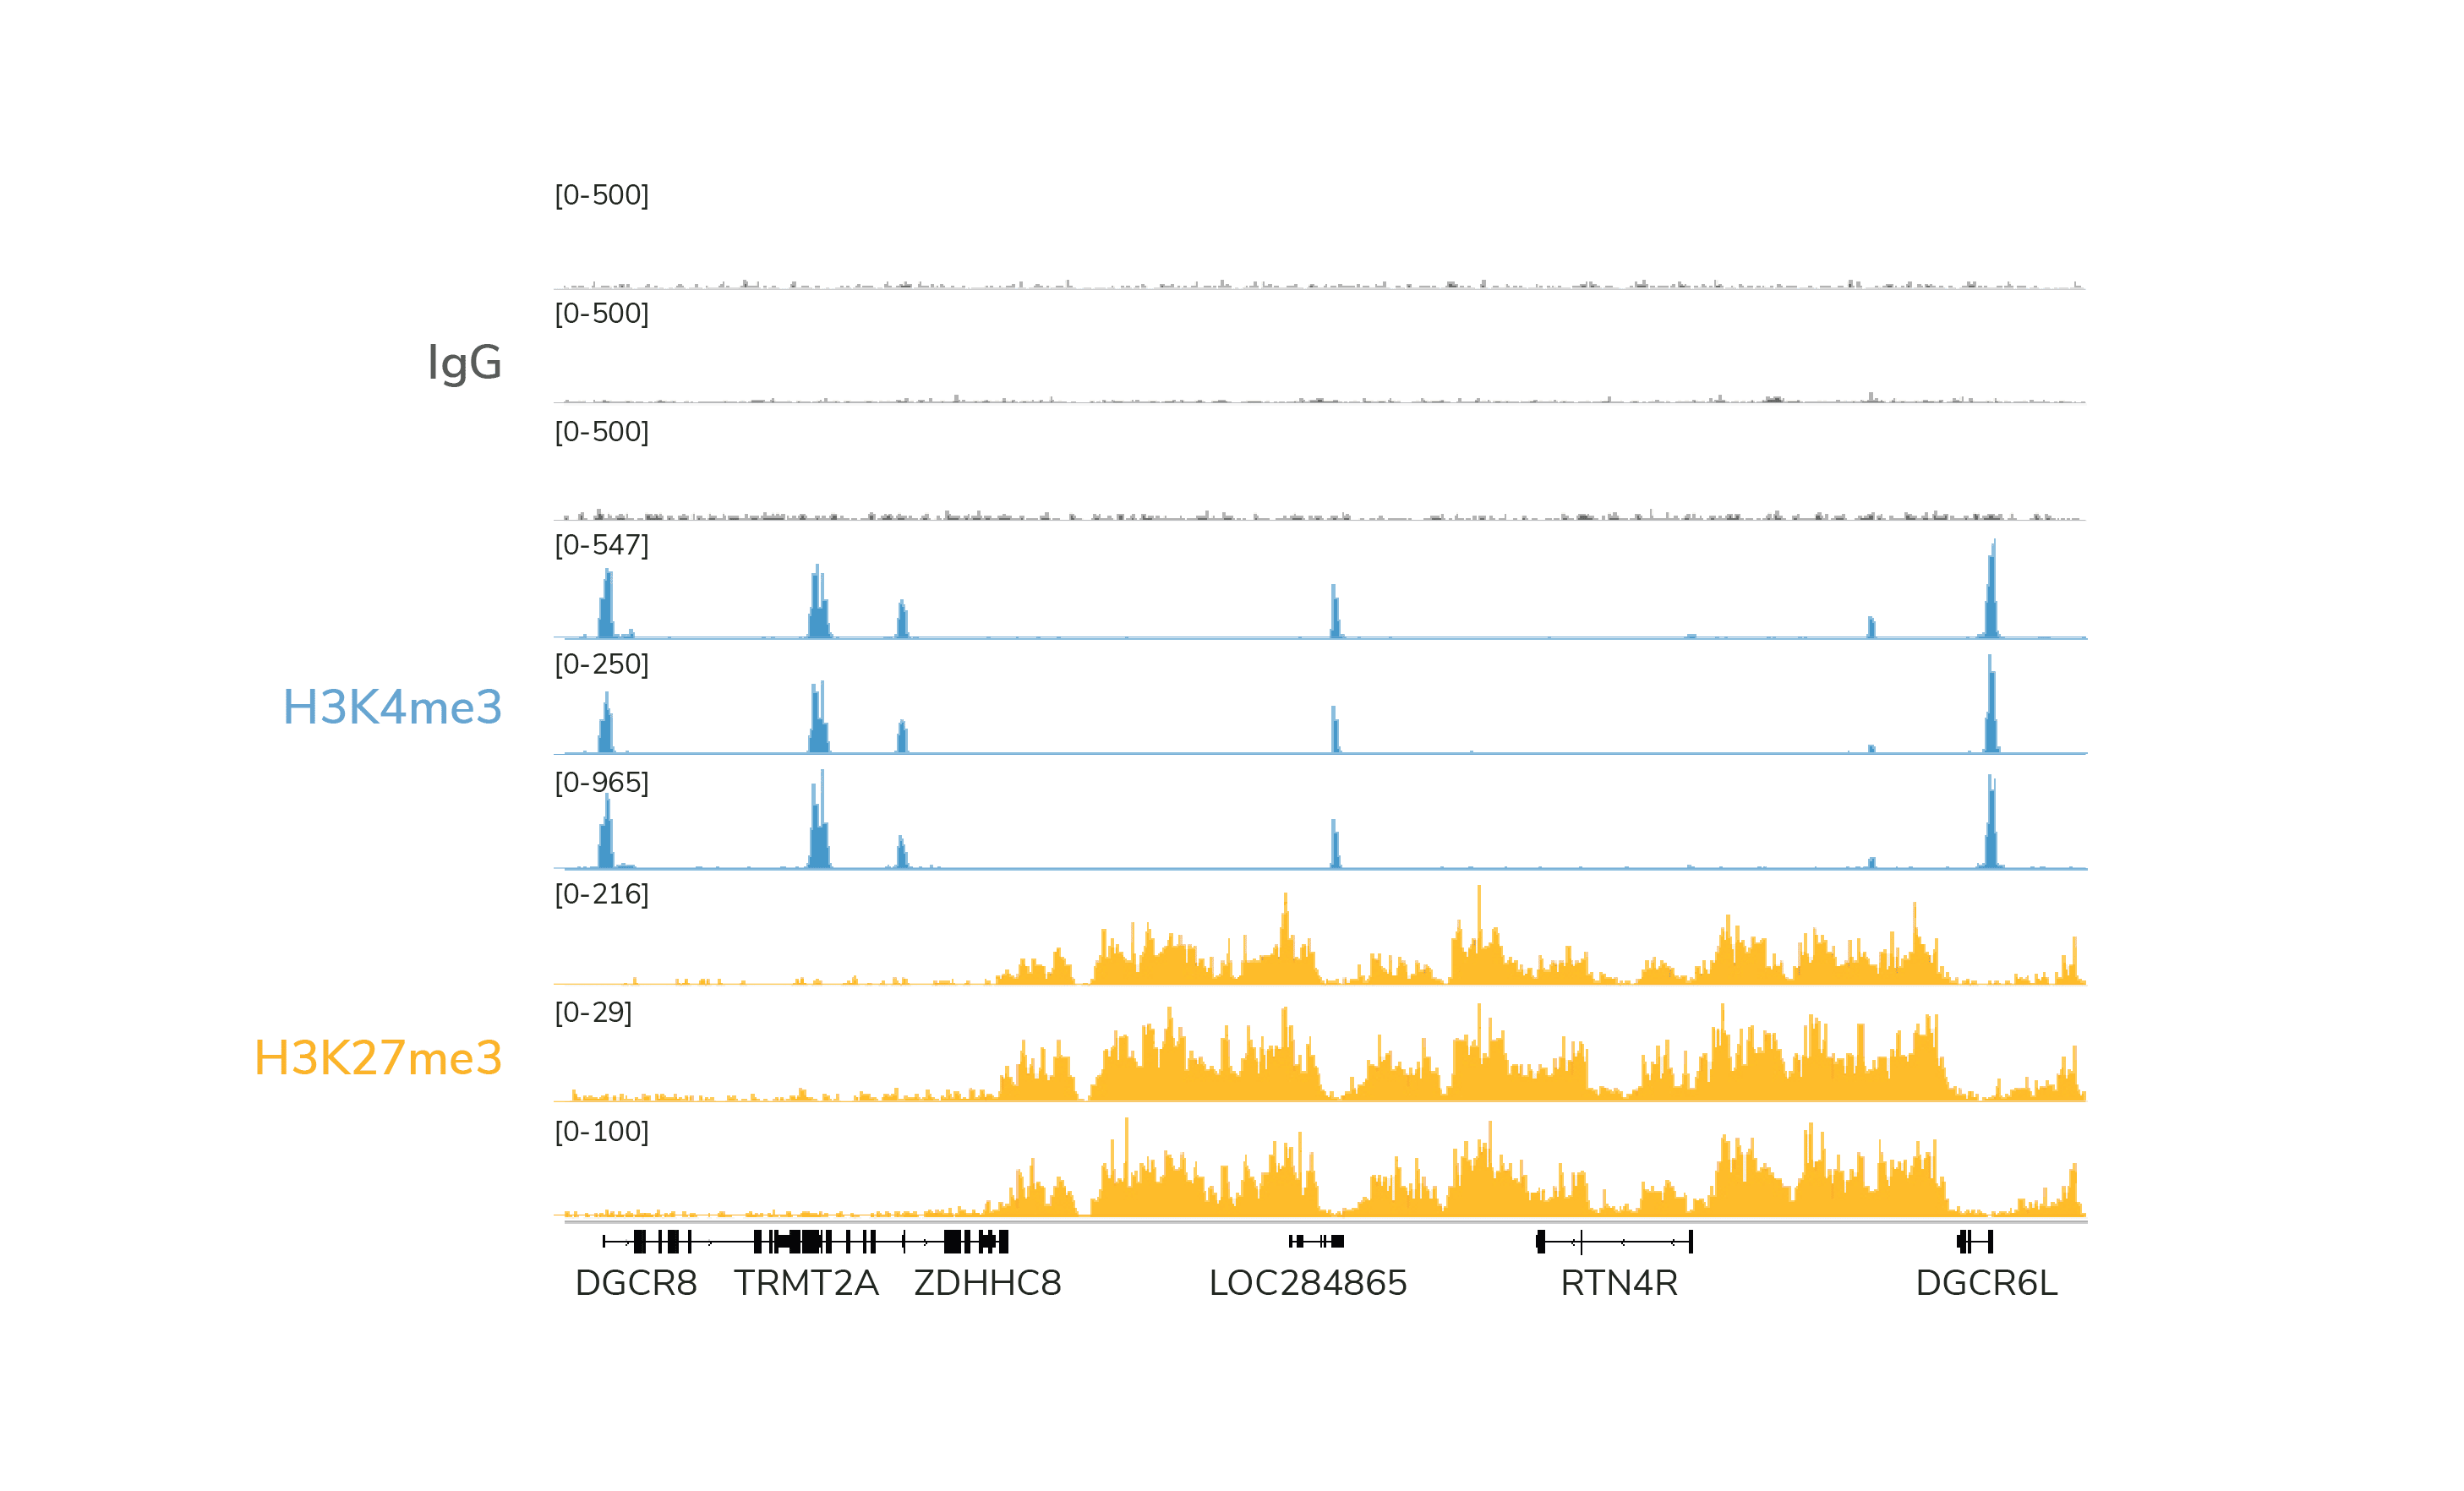
H3K4me3, H3K27me3, and IgG controls should show expected enrichment and peak structures.
Experimental replicates should be highly reproducible (Figure 1).
Looking for more on sequencing analysis?
For help with CUT&RUN sequencing analysis, including genomic alignment, peak calling, and signal-to-noise calculations, see this article.

Figure 1. Data generated by three independent users demonstrate expected enrichment, peak structure, and reproducibility of data generated with the CUTANA™ CUT&RUN kit. CUT&RUN was performed using 500,000 K562 cells and antibodies to IgG (negative control), H3K4me3 (positive control), and H3K27me3 (another positive control option). 3-6 million reads were generated per library. H3K4me3 tracks show sharp peaks localized to transcription start sites (TSSs), while H3K27me3 tracks show broad peaks over repressed regions. IgG shows typical low background.